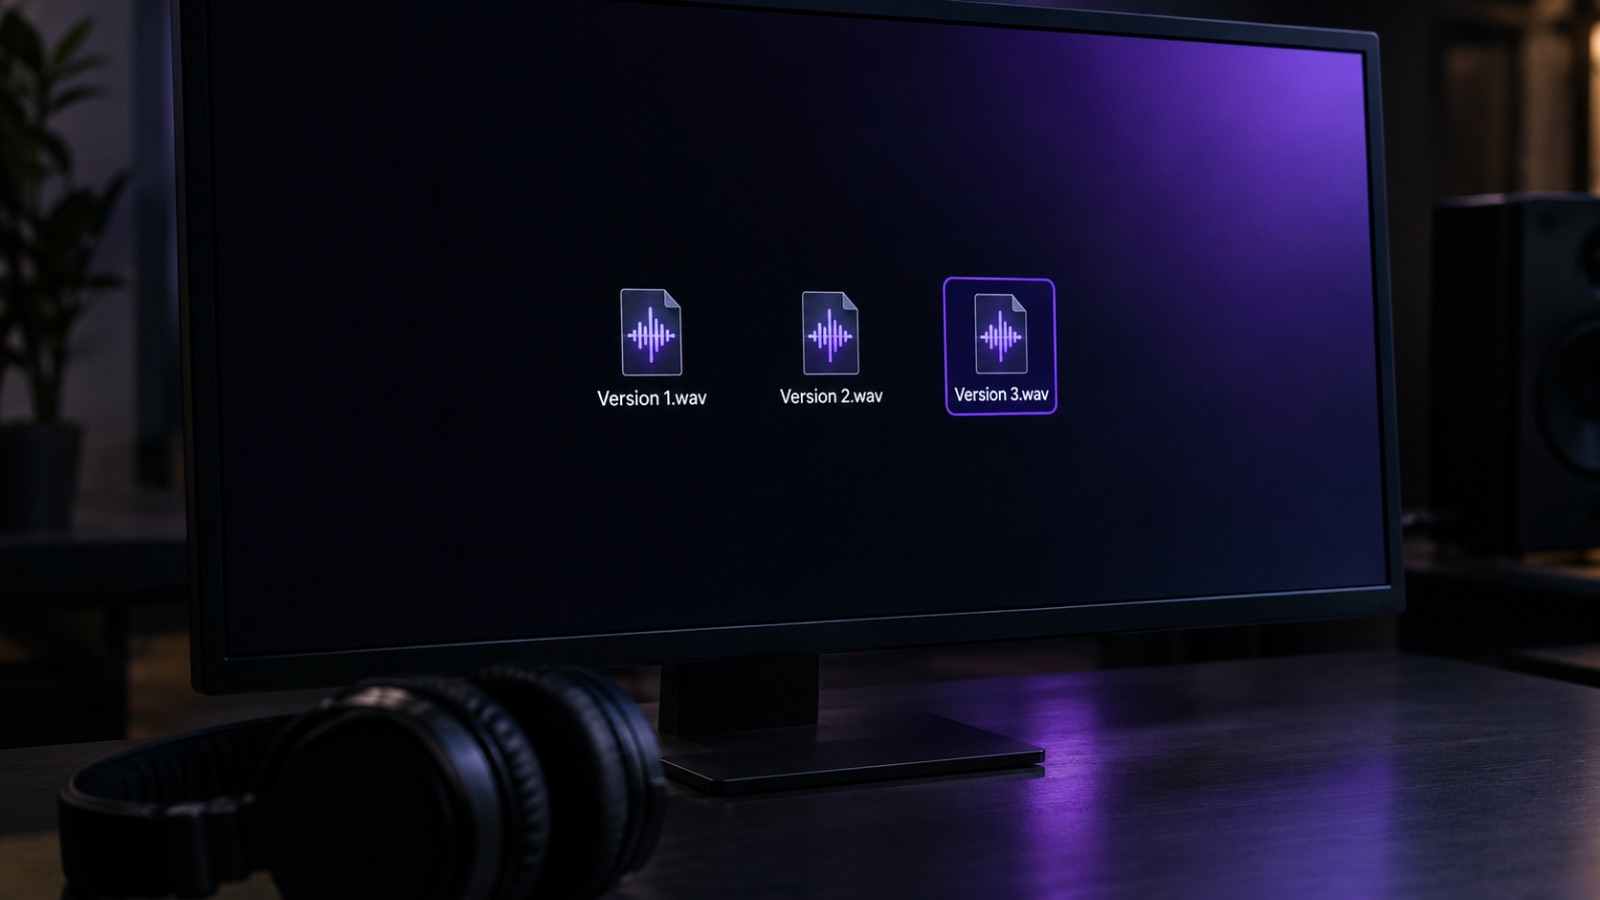
New: automatic loudness and dynamics analysis in the player
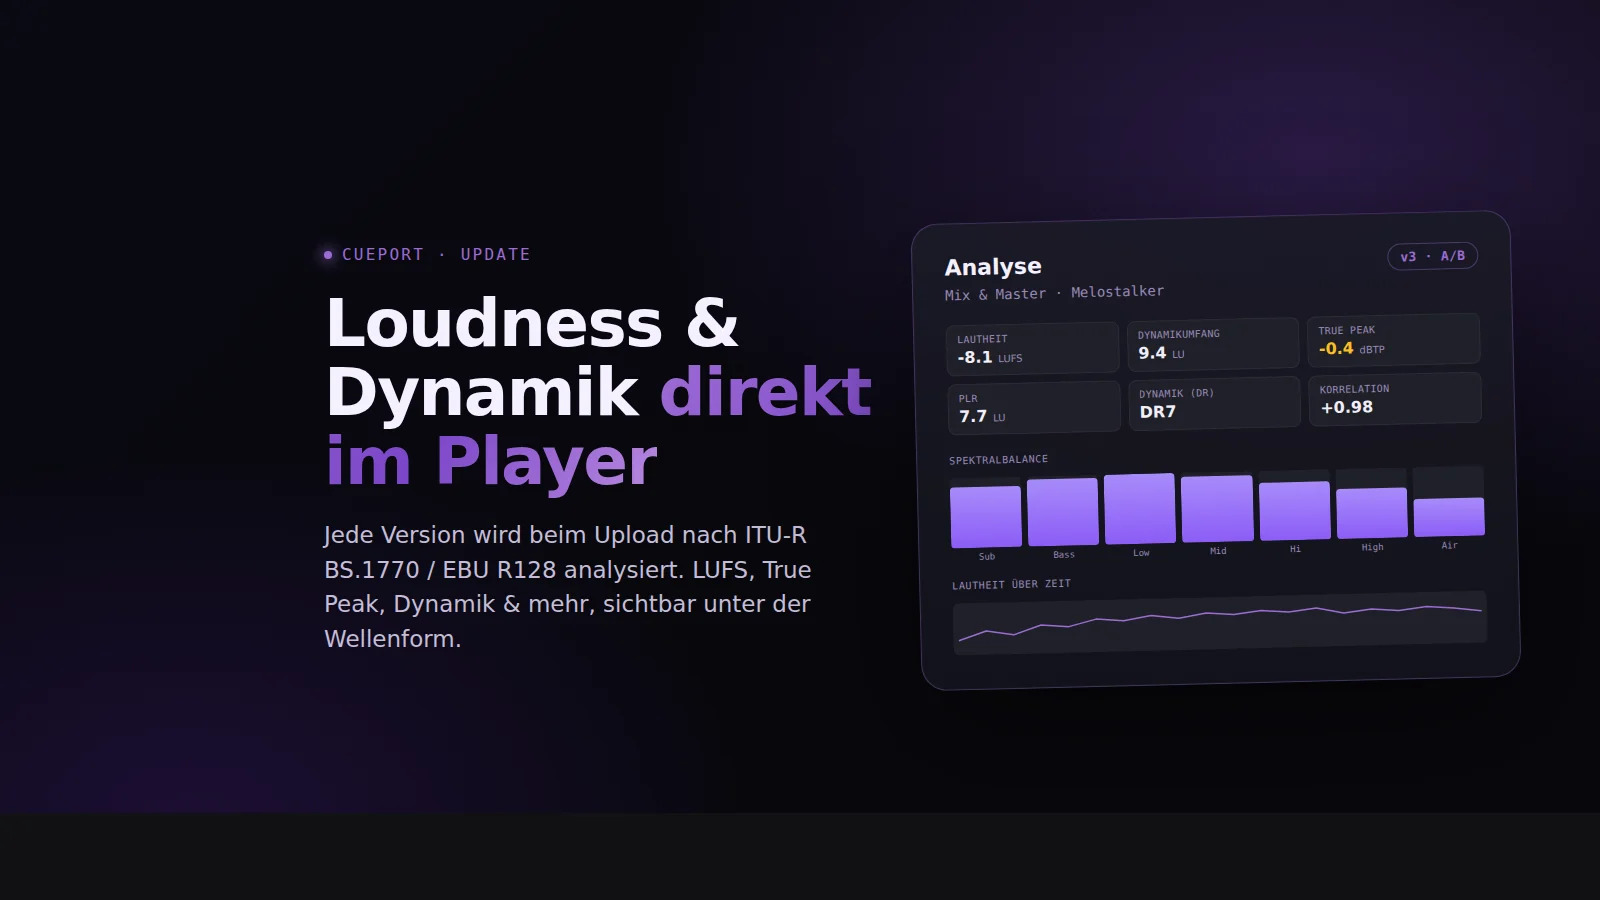
Quick update: CuePort now measures how loud and how dynamic your uploads are, on its own. Every version gets analyzed at upload, and the numbers sit right under the waveform in the player. No metering plugin, no second pass.
The math follows ITU-R BS.1770 and EBU R128, the same standard streaming and broadcast use. What you get:
- Loudness in LUFS and the loudness range
- True peak in dBTP, with oversampling
- Dynamics as a DR value and PLR
- Stereo correlation and width
- Spectral balance and a loudness curve across the whole track
In the studio portal you open the full panel: six core values, plus the spectrum, the curve and an Advanced section. Switch between two versions and every number shows the delta against the previous one. You can see at a glance whether the new version got louder or flatter. Each value comes with a short explanation.
The artist gets a stripped-down view with the three that matter most, loudness, peak level and dynamics, each with a plain-language note.
You don't have to re-upload your existing versions. Open an older one in the player and CuePort works the numbers out. Open it, expand the analysis panel, done.